Overview
This article will cover the new Quality Coding feature. It will allow you to tag and categorize observations from your sensors and their metrics. When you have tagged your observations with Quality Codes then you can filter those Quality Codes in your Graph and Table views.
As it stands in the summer of 2026, Quality Coding is not available for Array data and Vibration data.
This article will cover:
Configuring Quality Codes
The Quality Coding feature has some default Quality Codes that are set up when you create your asset. But you might want to configure some custom Quality Codes. You can configure those by navigating to Organization and Asset settings.
Once in Organization and Asset settings you can click the "Manage Quality Code" option to manage your Quality Codes.
Once you are in the Quality Code management menu you can add new Quality Codes and edit or delete quality codes.
When adding or editing a Quality Code you have the following options.
Name, which is what is displayed for the quality code selection in the Quality Coding feature.
Type is defining what category the Quality Code belongs to
Code(s) is an optional Quality Code numbering for your Quality Code.
Description is an optional additional description for adding more context to your Quality Code.
If you wish to delete a Quality Code you can select one or multiple Quality Codes and click the Delete button. A pop-up menu will appear that asks you to confirm the deletion, once you click OK it will delete those Quality Codes.
Using Quality Coding
In Graphs
Quality Coding can be accessed through Time Series Graphs in iTwin IoT. When you are viewing a graph in the system you can access Quality Coding by clicking the three dots and clicking the "Add quality Code" option. If you only have one metric in the graph then the Quality Coding feature will open up right away, if you have more than one metric then you need to click on the relevant metric in the graph to select it for Quality Coding.
Once you are in Quality Coding for your chosen metric you can either select a single observation for quality coding or you can select a range of observations.
To select a range of observations you can click on the "XY selection" option in the upper right corner of the graph. This will allow you to select a range of observations to Quality Code. Once you have done that you will be presented with a list of your selected observations in the table to the right.
You can select a maximum of 10.000 observations at a time
Once you have selected the observations you want to Quality Code, you select a Quality Code from the option above the table.
When you have selected your quality code and are satisfied with your selection you can either click "Save" to save your Quality Coding selection and close the Quality Coding feature or you can click the arrow and click "Save and quality code more" to quality code some more for your chosen metric.
In Tables
Quality Coding can be accessed through Tables in iTwin IoT. When you are in a Table profile you can select observations and quality code them.
To do so you select the observations you want to quality code and click the "Quality Code" button.
Once you click that button then the Quality Code selection dialogue will appear. Here you can select which quality code you want to assign to those observations you selected.
Filtering observations with Quality Coding
In Graphs
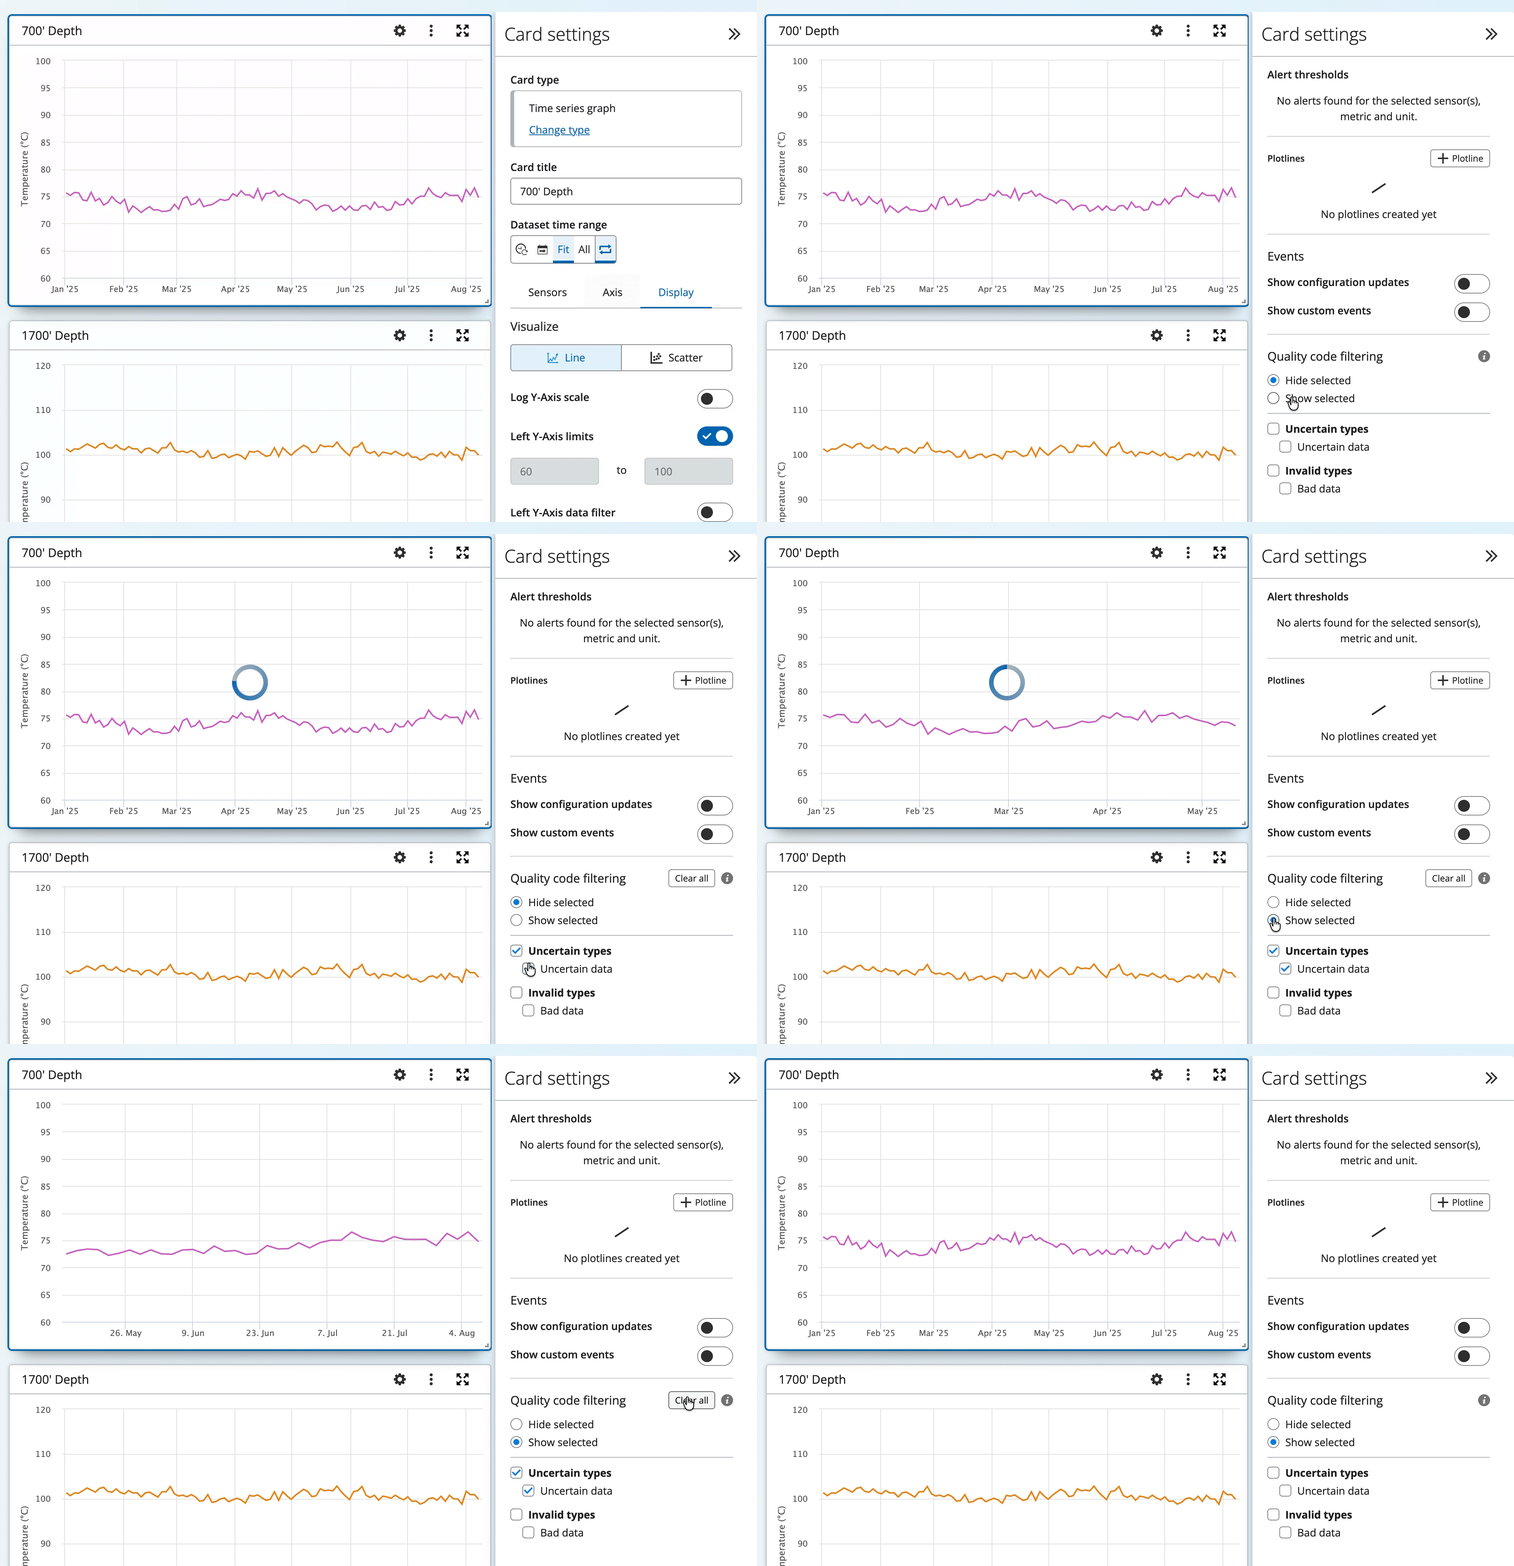
When configuring a graph you can navigate to the "Display" tab where you will find the Quality Code filtering option.
This will allow you to either hide selected quality codes or to show them. This setting will persist once you save your Dashboard or Graph profile.
 In Tables
When you are in a Table profile you can click the arrow next to the Quality code column and filter your quality codes.
If you do not see this column then you need to click the three dots to the right of the timescale option and check the "Quality code" option.
You have the same options as in Graphs, you can hide the selected quality codes or show only those quality codes. This setting will persist once you save your Table profile and is applied only per-sensor.