The Graph Object displays a bar chart or coloured box in the column. This is one of the complete objects that can be added to the Log.
To insert a Graph Object into a column, follow the steps below:
Select the first empty box below the column headers that the item is to be added to.
Double click on the Graph in the Depth Related section of the left hand side tree view.
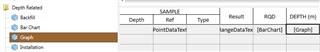
The Graph Object will now be added and the text "[Graph]" is inserted in the cell.
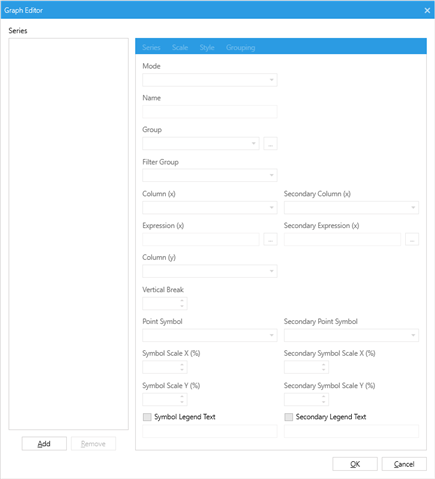
Note: There are no properties window to use as there are too many properties and therefore the Bar Chart Editor opens up.
A graph comprises of four things: (1) Series, (2) Scale and (3) Legend (4) Grouping (These are the three first tabs on the right of the series text box).
Contents
| Series Tab | |
| Scales Tab | |
| Legend Tab | |
| Grouping Tab | |
| Graph Notes | |
| Connector Bars | |
| Line Graphs | |
| Scatter Graphs | |