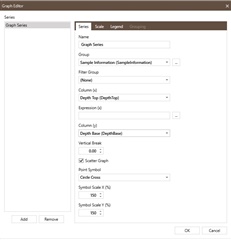
The first item that can be added is a Series by pressing the Add button below the Series text box.
The Series tab activates and then it is possible to type the name of the Series into the Name Box e.g. RQD.
It is then possible to choose the Table Name (Group) e.g. Coring Information (Coring) and the column X and column Y values e.g. Depth Top and RQD respectively.
There is an option to display the results as a scatter graph. If this option is selected you can configure the following
Point Symbol- Drop down option for choosing a range of point symbols to be rep-resented on the graph
Symbol Scale X and Y %- can manipulate size of the point symbols displayed on the scatter graph.
