Scope
The objective of this document is to guide users in the implementation and configuration of a new WaterSight project.
Available Modules and Data Requirements
OpenFlows WaterSight uses powerful Artificial Inteligence (AI) algorithms together with advanced analytics to bring new insights to water utilities. Based on the data that is available and integrated into the solution, different modules and capabilities become available. The Figure below illustrates a high level diagram of the main data source inputs (on the left) and main modules/capabilities (on the right).
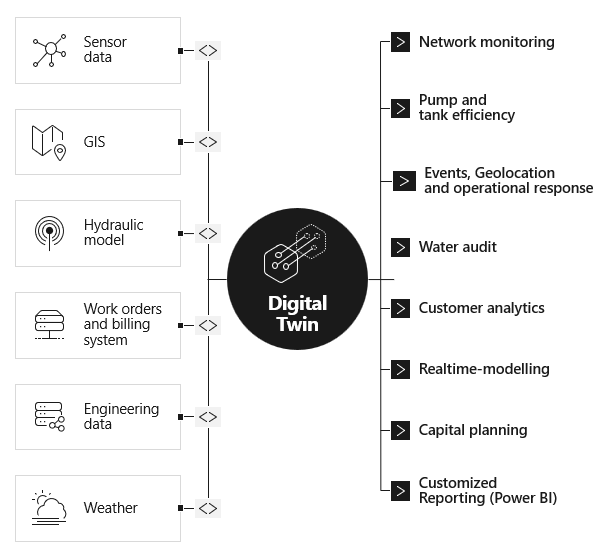
Table below describes in more detail each module/capability and main data requirements:
| Available Modules |
Description |
Required data inputs |
| Network Monitoring |
Real time monitoring of any sensor measurement, patterns calculation, forecasts and history navigation |
- Sensor data (historical time series data, real time series data, sensors properties/characteristics)
- GIS (pipes and zones) |
| Pump Assessment |
Calculation of pump operating points, efficiencies and costs |
- Sensor data (pump flow, pressure, status, power, VSP speed, etc)
- Engineering data (pump curves, best efficiency point, etc) |
| Tank Assessment |
Tank levels monitoring and tank turnover |
- Sensor data (level sensors)
- Engineering data (volume, max and min level, tank curves, etc) |
| Events and Alerts |
Generation of alerts and events management |
- Sensor data (historical time series data, real time series data, sensors properties/characteristics) |
| Geolocation of leaks |
Identification of the most likely spots of leaks inside a zone |
- Sensor data (real time series data, sensors properties/characteristics)
- Hydraulic Model |
| Operational Response simulation |
Simulation of emergency events such as pipe breaks, pump shutdowns, fires or big demands, valve operations. Understanding impacts of those events (affected customers, low pressures, etc) |
- Hydraulic Model |
| Water Audit |
Water Balance calculations per zone, including water losses calculation and division between real and apparent losses, and MNF indicators |
- Sensor data (historical flow time series data)
- Zones properties (inflows and outflows)
- GIS (zones polygons)
- Customer meter characteristics (location)
- Billing data (monthly billings for each customer meter) |
| Customer Analytics |
Analysis of customer meters per clusters/groups (age, type, brand, average consumption, zone, etc) |
- Customer meter characteristics (location, DN, brand, type, installation date, etc)
- Billing data (monthly billings for each customer meter) |
| Real time Modelling |
Real time modelling of the system (model boundary conditions automatically fed from real sensors measurements) |
- Sensor data (historical time series data, real time series data, sensors properties/characteristics)
- Hydraulic Model |
| Capital Planning |
Supporting identification of priority pipes for rehabilitation |
GIS (pipes, zones, others)
Hydraulic Model |
| Customized Reports |
Creation of customizable reports that can be included in WaterSight |
Power BI licence |
In the following section you can find the main steps and guidance on how to create a new digital twin, integrate the different types of data and procede with all configurations:
1. Initial Setup
Create a New Digital Twin
If you are creating the first Digital Twin in your organization's account, follow the instructions in Create a New Digital Twin. If you are adding an additional digital twin, see Managing Multiple Digital Twins.
Configure General Options
Once the Digital Twin is created, navigate to the Administration page and configure the following settings as described in the General Information section of Digital Twin Setup.
- Digital Twin Name
- Description (Optional)
- Image (Optional)
- Team Members (Optional)
At the beginning, add users who will be active in the configuration and early testing as Team Members. Once the Digital Twin is ready for general use, additional users can be added.
Make a note of the Digital Twin ID, which can be found by hovering your mouse over the Digital Twin Name field.
2. Download Template Files
While items such as sensors and tanks can be entered manually within WaterSight, it is often convenient to populate a list of items in Excel first and then simply upload the complete list. This can be accomplished with the Configuration Template. Once the initial configuration is complete, it is up to Administrator preference whether to maintain the Excel file for future updates, or perform all updates from the WaterSight interface.
Follow the instructions in the Template Files section of Digital Twin Setup to download the following files:
- Configuration Template
- Monthly Billing Template
Save these to a convenient location on your computer and rename as desired.
The configuration template comes by default with an example already populated so it can serve as reference for the user when filling it with its own data.
3. Recommended Configuration Workflow
The configuration order for a Digital Twin is flexible, and can be adjusted based on what data is readily available and what functionality is a priority. The following is a recommended workflow for configuration which prioritizes establishing a sensor connection, preliminary water audit functionality, and hydraulic modeling functionality.
All the digital twin configuration is done through the Administration page of WaterSight.
General Tips
The following tips apply to the Configuration Excel file and most tables in the Admin configuration pages of WaterSight:
- The Configuration Excel file already contains several validation rules to help the user minimizing possible errors while completing the file. When copying and pasting values from external sources to the configuration template file, please use the paste as value option so that eventual validation errors can be listed and highlighted. Please note that for some fields specific type formats are required.
- In general, uploading a Configuration Excel file only affects the current administration page. For example, uploading a file to the Sensors page will not also load Customers, even if a Customers tab exists in the Configuration file. The exception to this is that if an item references a different item type (such as a Pump with an associated Pump Station), the referenced item will be created.
- Uploading a new copy of the Configuration file after a list is already populated will add new items and update existing items. Items that exist in WaterSight but not in the Configuration file will be kept (will not be automatically deleted).
- In WaterSight, in the administration pages, not all fields are shown as columns in the table. To see and edit additional fields, you can select a row in the table and look at the sidebar that appears.
- Not all fields available in the Configuration Excel file are required. The minimum required fields are marked in the Configuration Excel file with an asterisk in the column.
- In the Configuration Excel file please make sure that the names of the columns headers as well as the names of the excel tabs remain as the original ones; otherwise there will be an error when uploading the template file into WaterSight.
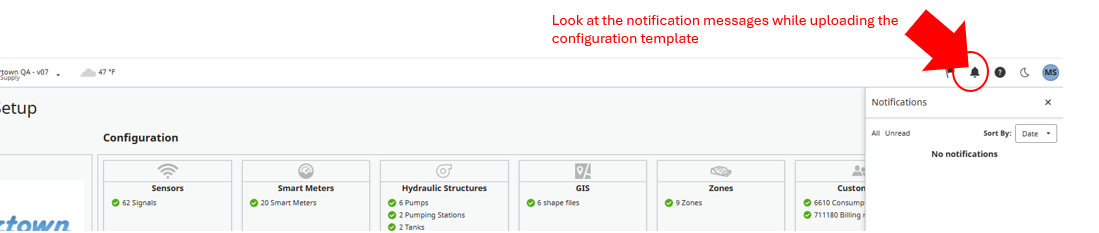
- When the import of the configuration file fails, there is an explicit error provided to the user explaining the reason why it failed. This error should get listed under the notification bell located on the top right corner of the WaterSight application
3.1. Settings
Under the Settings Configuration page, begin by defining the desired Units, Service Expectations, Costs, Global coordinates and time zone, and Coordinate Systems. The remaining settings can be defined later as needed.
Note that the non-definition of the global coordinates or the time zone will have a big impact with weather data or zone patterns not being correctly displayed.
Units:
For each parameter, select the preferred unit. If desired, the display precision can be adjusted. Please note these are the display units you will want to see in WaterSight.
Service Expectations:
The pressure values are used during model simulations to identify customers with higher or lower pressure than is desired. Typical values are 20 - 100 psi (14 - 70 m H2O).
The target pump efficiency is used for identifying pumps whose average efficiency is lower than desired, and the associated energy costs. A default value of 60% can be used to start.
Percentage energy from renewable sources and CO2 Emission Factor are used for calculating the carbon footprint. Default values of 0% and 0.4 kg/kWh can be used to start.
Costs:
Water production cost and water tariff are used to estimate the value of various water categories in the Water Audit. These may vary significantly from one utility to another.
Average energy cost is used to estimate costs and savings related to pumps. This may vary significantly from one utility to another.
Global:
Location - As a first step, identify a Latitude and Longitude near the center of the utility. Enter this value under Digital Twin Setup --> Settings --> Global. This will be used to automatically get the Weather data, as real-time, historical, and forecast.
TimeZone - Make sure to define the correct time zone of the digital twin. This will be used to correctly set the patterns for the sensors and zones.
Coordinate Systems:
Prior to uploading the Sensors, Customers, Work Orders, or Smart Meters, the coordinate system needs to be specified so that x/y or latitude/longitude values can be properly shown on maps. Begin by finding the Sensors and Customers codes, and update the others as needed.
Typically, these features will be exported as a table from a GIS shapefile or geodatabase. In most cases, the EPSG code or a description of the coordinate system can be found by examining the layer properties in any GIS software. Note that each layer may have different coordinate systems if the utility has not standardized to a single system. EPSG codes can be found by searching https://spatialreference.org/ .
If the coordinate system does not have an EPSG code, or if the EPSG code is unsupported, the data will need to be reprojected into a different coordinate system prior to exporting to a configuration table.
Once the EPSG code is identified, navigate to Digital Twin Setup --> Settings --> Coordinate Systems and enter the EPSG codes.
3.2. Sensors
It is a good idea to start with the Sensors, as these are referenced by many other aspects of WaterSight. In the Configuration Excel file, go to the Sensors tab and fill out the information for the sensors you would like to include in WaterSight. As the configuration template downloaded previously comes by default with an example already populated, the examples there can serve as reference and guide the user when filling with its own data.
The ID/Tag field should exactly match the values in the source database (such as a SCADA Historian) where the time series will be obtained from. The Name field can be a more intuitive label that is understandable to the utility operators. It is typically helpful to name the Sensors based on the associated physical asset and the parameter being measured, such as "Bald Hill Tank Level" or "Well Pump 1 Downstream Pressure".
Once the Sensors table is complete, use the Import button on the Sensors table to load the information into WaterSight.
For more information, including a detailed list of the columns in the Sensor Configuration Table, see WaterSight - Sensors.
When uploading the configuration template take attention to potential errors or warnings that will be listed under the notification bell icon. In case there are issues during the template upload, those messages usually provide more detail about the type of error.
Note: In the Configuration Excel file please make sure that the excel tab named "Sensors" remains with its original name and that the names of the columns headers are also not changed and remain equal to the original names; otherwise there will be an error when uploading the template file into WaterSight.
Please also note that the template is only used to bring every sensor property but not the time series values. The time series values should be automatically brought to WaterSight in near real time, after the sensor connection has been set up. Please see subchapter 3.4 below for more information on how to set the connection.
A quick guide on how to add and update Sensors can also be found here - Adding and Updating new sensors or smart meters.
3.3. Smart meters
Smart meters (AMI meters) can also be integrated into WaterSight, following a similar methodology as the normal network sensors. Smart Meters are intended for large or particularly important customers that have consumption readings at approximately hourly resolution from either Automated Meter Reading (AMR) or Advanced Metering Infrastructure (AMI).
Due to the volume of data involved, Smart Meters are currently not intended to be used for all customers within a utility. WaterSight is intended to integrate with smart meters from large or critical customers, up to a limit of 2 000. With this integration it is possible to monitor large customers flow, generate alerts, understand the influence of large customers on zones flow (more effective leakage management). It is also possible to have the smart meters consumption automatically being adjusted into the real time hydraulic model – more information here.
In the Configuration Excel file, go to the Smart meters tab and fill out the information for the smart meters you would like to include. The ID/Tag field should exactly match the values in the source database where the time series will be obtained from. The Name field can be a more intuitive label that is understandable to the utility operators. As the configuration template downloaded previously comes by default with an example already populated, the examples can serve as reference and guide the user when filling with its own data.
Once the table is complete, use the Import button on the smart meters table to load the information into WaterSight.
For more information, including a detailed list of the columns in the Smart Configuration Table, see WaterSight - Smart meters.
When uploading the configuration template take attention to potential errors or warnings that will be listed under the notification bell icon. In case there are issues during the template upload, those messages usually provide more detail about the type of error.
Note: In the Configuration Excel file please make sure that the excel tab named "Smart meters" remains with its original name and that the names of the columns headers are also not changed and remain equal to the original names; otherwise there will be an error when uploading the template file into WaterSight.
Please also note that the template is only used to bring every sensor property but not the time series values. The time series values should be automatically brought to WaterSight in near real time, after the sensor connection has been set up. Please see subchapter 3.4 below for more information on how to set the connection.
A quick guide on how to add and update Smart meters can also be found here - Adding and Updating new sensors or smart meters.
More information about Smart meters and Large Customer workflows can be seen here - Smart Meters/AMI and Large Customers Workflows
3.4. Sensor Data connection
Once the Sensor and/or smart meter list has been populated, the user can start to setup the connection to the sensor and smart meter data sources, so that time series values start to arrive automatically in WaterSight in near real time. There a
To automatically integrate this data there are two main methods:
- Using Data Pusher tool, which can directly connect to the sensors databases
- Through a Rest API connection
An explanation summary can be found in this article - Sensor Data Acquisition Requirements. For more complete detail on how to set up the connection, please ask your Bentley point of contact for the OFOSC and RestAPI Detailed Guide.
To confirm that data is successfully being pushed into WaterSight, navigate to the Network Monitoring Graphs page, and check that graphs have data for the expected time range that data has been pushed. It may take a few minutes for the initial load of data to occur.
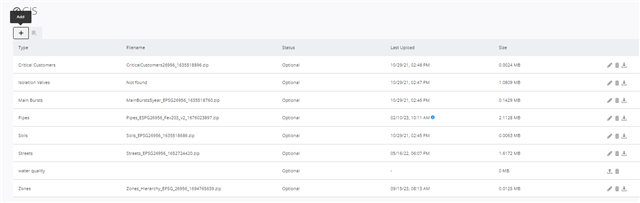
3.5. GIS
Using any GIS software, create a polygon shapefile for the Zones and polyline shapefile of the Pipes in the utility network. See instructions for Uploading Zone Shapefiles and and Uploading Pipe Shapefiles in WaterSight - GIS. Note in particular that the Zone shapefile must include a column called "Name", and the Pipe shapefile should have a column called "ID". It is helpful for search functionality if the Zone name includes the word "Zone" or "DMA". For information about creating zones shapefile, click here.
The Pipe ID should either be populated to match the Pipe Label or Pipe GIS-ID in a WaterGEMS hydraulic model. Best practice is to use a unique ID from the GIS, software, and associate that to the GIS-ID field within WaterGEMS. This supports multiple GIS-IDs for a single pipe, such as in the case of merging multiple pipe segments into a single model pipe.
Consider adding as many informative fields as possible to the pipe shapefile, such as installation year, material, and other parameters that would be useful for the capital planning assessment module of WaterSight. For more information on how to start with the capital planning module, please click here.
You can optionally add as many additional GIS layers as you like, by directly clicking in the "Add" button on top of the GIS table, in the administration page. These can be layers useful for operations such as the location of critical customers, bursts and also layers useful for capital planning assessment, such as polygons for soil type.
It is also possible to upload other map layers such as from WMS and WMTS sources or even create direct connection to ArcGIS databases. More information can be found on this page, under the Map layers section.
3.6. Zones
For each Zone, and for the system as a whole, fill out the information as described in WaterSight - Zones. The list of Zones is automatically populated based on the Zone GIS file. It is not possible to manually add a zone. To add a new zone, upload a new Zone shapefile.
Zones should correspond to isolated distribution network areas of the system, surrounded by closed valves and where all inflows and outflows (if exist) must be measured. Zones can include for example DMA (District Metered Areas), pressure zones or operational zones. The most important fields to fill out for Zones are the list of Flow In, Flow Out, and Storage sensors, as well as the Parent zone if a hierarchy is being used. If needed please make sure to update/change the zone polygons in order to match the real area being measure by the inflows and outflows. More information can be seen here - Defining Zones in WaterSight.
Initially, an estimate of 1% can be entered for the "Auth. Unbilled Consumption (% of total revenue)" field, and 20 to 30%% can be entered for the "% to Consider (MNF consumed)" field. These values can be refined during Water Audit validation.
Review Zone Net Flow
After Sensors, OFOSC, and Zones have been defined, navigate to the Network Monitoring --> Graphs --> Zone Overview page. This shows a calculated Net Flow for each zone, accounting for inflow, outflow, and storage in tanks. Perform an initial review of whether the data looks reasonable. Consider:
- The average flow rate in each zone. Is it reasonable given what you know of the demand and non-revenue water for that zone?
- The pattern. Does it follow a typical daily shape?
- Data gaps. Are there frequent or extended periods where one or more of the sensors is missing data, leading to a gap in the Net Flow calculation?
- Negative Values. Negative Net Flow is not physically possible.
- Sudden changes or extreme values. These can be due to sensor errors, unmetered flow entering or leaving the zone, events such as leaks or fires, seasonal or holiday demand changes, and many other factors.
Make a note of which zones have reasonable Net Flow, and which require further investigation. Typical investigation activities include:
- the review of all DMA boundary valves (and checking in the field if they are really closed),
- checking if all inflow and outflow sensors as well as storage sensors are well defined (there are no unmetered entrances/exits to the zone)
- sensors are not misconfigured
3.7. Customers
Meters
In the Configurations Excel file, populate the Customer Meters tab. This will typically begin by exporting a list of all customers either from a GIS layer or a customer billing database. Customers can either explicitly be assigned a zone, or given coordinates which WaterSight will match to a Zone using the GIS zone shapefile.
Once the Configuration excel tab is ready, upload to WaterSight. For details, including a description of each field in the spreadsheet, see WaterSight - Meters Characteristics. Note that most of the fields are optional and not required for basic Water Audits, but can enhance other views such as the Customer Meter Analytics. As the configuration template downloaded previously comes by default with an example already populated, the examples can also serve as reference and guide the user when filling with its own data.
Note that the list should contain all customer meters within the Water Utility, including those that might have smart meters.
When uploading the configuration template take attention to potential errors or warnings that will be listed under the notification bell icon. In case there are issues during the template upload, those messages usually provide more detail about the type of error.
Note: In the Configuration Excel file please make sure that the excel tab named "Customer meters" remains with its original name and that the names of the columns headers are also not changed and remain equal to the original names; otherwise there will be an error when uploading the template file into WaterSight.
It is also possible to connect customer meter data automatically through the usage of an API. For more information reach to you Bentley point of contact or submit a help service ticket.
Billing
In the context of WaterSight, Customer Billing refers to the total monthly volume billed by each customer. The most reliable source for this information is typically from the utility's billing software, after any audits have taken place. Financial records (such as the dollar amount billed to the customer) are not included in WaterSight. If customer meters are not billed every month, a process may be set up to estimate monthly volumes prior to uploading to WaterSight.
To upload the billings into WaterSight the user can fill the "Monthly Billing" tab included in the general configuration excel file, or just use the Monthly Billing template that can also be downloaded from the application. Note that if uploading the configuration excel file, there must exist a tab called "Monthly Billing" and the columns headers labels must not be changed (this same rule applies when uploading the separated Monthly Billing CSV file).
To upload customer billing, follow the instructions in WaterSight - Customer Billing. Billing records can only be uploaded after Customer Meters have been defined. As the configuration template downloaded previously comes by default with an example already populated, the examples can serve as reference and guide the user when filling with its own data.
If possible, the initial upload should include billing records over the same historical period as Sensor data has been uploaded, so that a historical Water Audit can be analyzed. Typically, a period of at least 2 years is ideal.
Note that the billing list should contain all customer meters within the Water Utility, including the monthly billings for those meters that might have smart meters (and were already uploaded under Admin >> Smart meters).
When uploading the configuration template take attention to potential errors or warnings that will be listed under the notification bell icon. In case there are issues during the template upload, those messages usually provide more detail about the type of error.
It is also possible to import billing data automatically through the usage of an API. For more information reach to you Bentley point of contact or submit a help service ticket.
3.8. Review the Water Audit
After Sensors, OFOSC, Zones, Customer Meters, and Customer Billing have been defined, and after an initial Zone Net Flow review, navigate to Water Audit --> Water Balance. Focus on zones that have reasonable results for the Zone Net Flow. Begin by comparing the Authorized Consumption and Water Losses percentages. Confirm that these are within expected ranges for the utility. Optionally, you can adjust the Authorized Unbilled Consumption and Water Loss settings in the Zone Configuration page.
Water Balance data reliability and accuracy can be significantly affected due to several factors such as:
- Customers are not updated or not assigned to the correct zone,
- Zones balance are not correct (definition of all input, output and storage sensors),
- Some sensor is/got misconfigured,
- Boundary valves between zones that are assumed to be closed, and that are in fact opened (field work validation to check the status of all zones boundary valves may be an important task),
- Water utility is unaware of any large customer with significant consumption during the minimum nightly flow period,
- Night-Day factor is assumed to be 1 in WaterSight. Real losses volumes are being calculated based on a MNF, assuming that the real losses flow (calculated by subtracting the zone MNF to the MNF consumed) obtained during the night period is constant along the day. This assumption can work well for zones with small pressure variations along the day, however in some cases, such as zones that are regulated by PRV with more than one setpoint for example, results should be analyzed carefully (the higher the pressure, the higher the background leakage flow; the lower the pressure, the lower the background leakage flow).
After the initial configuration of WaterSight, a more thorough review of the Water Audit can be performed to ensure the results are reliable, correcting any issues with the data that are discovered. More information about the water audit, click here.
3.9. Numerical Model
One of the advantages of WaterSight is that it can automatically and continuously feed the hydraulic model boundary conditions with real time measurements from sensors (such as real time measured tank levels, real time measured pump status, real time measured PRV settings, etc) and also with real demand patterns, turning the traditional static hydraulic model into a much more accurate real time hydraulic model of the water system. In WaterSight the model will run automatically at a given frequency defined by the user, with a user defined hindcast and forecast period. For more information about how to prepare a WaterGEMS model for running in real time in WaterSight, take a look at this article.
Prior to uploading a hydraulic model, review the tips and requirements described in WaterSight - Numerical Models article. To highlight that it is highly recommended to turn off and delete track changes in the WaterGEMS model prior to upload in WaterSight and also to upload a zip extension file (with just the sqlite extension) for performance reasons.
After uploading the model, the following default settings are recommended:
- Spinup: 0
- Hindcast: 6 or 12 hours
- Forecast: 12 or 24 hours
- If insufficient controls are defined in the model, start with 0 hours forecast.
- As calibration is improved, model results are validated, and model controls are defined, the forecast period can be increased.
- Run Frequency: Every Hour
- Demand Adjustment: None
- As Zone Net Flow results are reviewed and validated, this can be changed to "Update Demand & Patterns (zone-by-zone)", selecting the individual zones that have reliable Net Flow results.
- HGL Adjustment Signals: None (if model provided does not contain the transmission system and only covers the distribution system, it is highly recommended to enable this option On. More information here)
- Active: True
- Display GPV As: Isolation Valve
- This can be changed if most of the GPV elements in the model are used as Control Valves.
- Display TCV As: Control Valve
- This can be changed if most of the TCV elements in the model are used as Isolation Valves.
- Allow valve status update through API: No
- This setting is to enable advanced scripting.
Once uploaded, the hydraulic model will come with a predefined set of "default" style configurations, that includes the hydraulic model parameters to be visualized, their colour, size and legend scale. Those default configurations can be edited, and the user can also add more style configurations to be displayed on the pipes and junctions, such as node demands or water trace. More information here - Manage Styles.
Additional information on the numerical model configuration:
3.10. Configuring Triggers for Alerts
Create a Subscriber Group with a name such as Configuration Testing, and select the users who will receive alerts during the testing phase through email.
Set up a few basic alerts. The below articles contain some tips to configure bursts alerts and pressure/level alerts:
Additional alerts can be defined later in response to operational needs. For additional information, including a description of all alert trigger fields/option, see Alerts Administration help page.
The main variables that will automatically trigger alerts are the minimum duration and the threshold value. The user should test different combinations in order to find the best balance so that there will not be generated to many events (false positives) and to few alerts (missing important leaks). To test different trigger rules and decide on the best, it is highly recommended to use the Trigger Preview - more information here, under Trigger Preview section. Below some examples of alert configurations:
Sample Alerts (examples):
Name: Zone High Flow (Burst)
- Search & select: All items with "Zone" or "DMA"
- Measurement: Flow
- Type: Pattern
- High/Low: High
- Value / Threshold: 200 gpm (example). More information here.
- Notes:
- Units will depend on what is defined in Settings --> Units.
- The threshold can be adjusted based on normal variation to minimize false positives.
- If different zones have dramatically different normal flow rates, you can make several different alerts with different thresholds, grouping together zones of similar size
- It is usual to define large burst alerts, medium burst alerts and small leak alerts for each zone. More information about this, threshold and minimum duration values can be found here.
Name: Missing Flow Data
- Search & select: All items with "Flow"
- Measurement: Flow
- Type: No Data
- Notes:
- Flow sensors are often the most critical to restore quickly in case of an outage.
- It is recommended not to set a minimum duration period very small to avoid generation of a large amount of alerts. A minimum duration of 1 day is recommended.
Name: Flat Line Flow Data
- Search & select: All items with "Flow"
- Measurement: Flow
- Type: Flat Reading
- Value / Threshold: keep the software default. More information can be found here here.
- Notes:
- Flow sensors are often the most critical to restore quickly in case of an outage
Name: Low Pressure
- Search & select: All items with "Pressure"
- Measurement: Pressure
- Type: Absolute
- High/Low: Low
- Value / Threshold: 25 psi (example). More information can be found here.
- Notes:
- Units will depend on what is defined in Settings --> Units.
- Set the threshold a little above the minimum required pressure for adequate service.
- Note that some pressure sensors at pumping stations or other facilities may be at a significantly higher or lower pressure than the active distribution system. If necessary, group these sensors separately and apply thresholds that reflect minimum desired conditions at their locations.
Low levels
- Measurement: Pressure
- Type: Absolute
- High/Low: Low
- Value / Threshold: 2m (example). More information can be found here.
- Notes:
- Units will depend on what is defined in Settings --> Units.
- Levels below minimum can indicate a potential shortage inside the tank
High levels
- Measurement: Pressure
- Type: Absolute
- High/Low: Low
- Value / Threshold: 5m (example). More information can be found here.
- Notes:
- Units will depend on what is defined in Settings --> Units.
- Levels above the maximum can mean a tank overflow
Once alerts are saved, the recent history (until one wee back) will be automatically scanned to see if the trigger conditions have been met recently. If so, alerts will be automatically generated and they will be displayed in the Active Event list and map page of WaterSight, in order to be managed by the water utility (Alert Management Workflow). If there are sensors or zones that have frequent data problems and are generating false or excessive alerts, these can be removed from groups, or groups can be temporarily turned inactive until the issues can be investigated and resolved. Please note that deleting an alert from the administration will also delete all the associated events that are in the application and were generated from that alert trigger.
Finally, the user can also create combination of different simple alerts. More information here.
3.11. Geolocation of Leaks
Note that it is very important to assign burst alerts to zones (based on flow increase), as it will help the utility to identify the areas with anomalies in real time. In addition to this, once an event is generated for a zone, the user will be able to further run the geolocation tool, to help pint-point the location of the leak/burst inside the zone.
3.12. Pumps and Pump Stations
In the Configuration Excel file, fill out the Pump tab. For each pump in the system, include as much information as is readily available. Additional information can be added later if it requires further research. See Pumps Administration for a description of each of the fields in the table. The Pump Configuration guide is also available here.
The Design Point can often be found in pump station design documentation, pump procurement documentation, or on the pump data sheet provided by the manufacturer.
The Pump Curve, Efficiency Curve, and Power Curve are typically provided by the pump manufacturer. There are several common styles of graphs used by manufacturers that may take some practice to be able to read. Sometimes all three share a common Flow axis and need to be read against the proper Y-axis (Head, Efficiency, Power). In other cases, Efficiency is not shown as a typical graph, but rather as isolines (lines of constant efficiency). In some cases (particularly for older pumps), the data sheet may only show the Pump Curve (Flow & Head), and the Efficiency and Power may be unavailable.
For each pump where curve information is available, enter the data on the Pump Curves tab of the Configuration Excel file. Read points off of the manufacturer graph. Typically about 5-7 points spaced out between 0 Flow and the highest flow on the curve are sufficient. The points don't need to be exactly evenly spaced. Enter these points into Excel as consecutive rows in order of ascending flow and select the appropriate Curve Type (Head, Efficiency, or Power). Then give all rows in the curve the same Name. This Name is then referenced in the Pump tab under Head, Efficiency, or Power Curve Name columns.
Note that if multiple identical pumps are installed, you can reuse the same curves for multiple pumps.
If multiple pumps are in a station together with a common flow meter, they can all have the same Flow Sensor assigned. As long as a Status Sensor is available, WaterSight will estimate the flow contribution of each individual pump.
Multiple pumps sharing a common flow meter can also be assigned to a Pump Station (even if the pumps also have individual flow meters prior to combining). Enter the Pump Station Name in the appropriate column of the Pump tab, and then in the Pump Stations tab enter a row for the station. See Pump Station Administration for a description of each field in the table.
Once all readily available information has been entered, upload the Configuration file to both the Pump and the Pump Stations tables.
To verify that information is entered correctly, navigate to the Pumps page and explore the graphs. Check whether the operating points from the sensor data align with the expected behavior from the manufacturer curves. Note which pumps require further investigation, either to find additional information or to troubleshoot unexpected behaviour. For more information on interpreting the graphs, see Pump Overview, Pump Details and Pump Stations Details.
When uploading the configuration template take attention to potential errors or warnings that will be listed under the notification bell icon. In case there are issues during the template upload, those messages usually provide more detail about the type of error.
3.13. Tanks
In the Configuration Excel file, fill out the Pump tab. For each pump in the system, include as much information as is readily available. See Tank Configuration for more information, including a description of each field in the table.
The Tank Curve is an optional field which can be used to more accurately estimate the volume available in a tank based on the level. Rectangular or cylindrical tanks have a linear relationship between level and volume, so no curve is necessary. Values for a curve can be estimated by examining a scale profile of the tank from construction drawings. Typically approximately 6-8 points are sufficient to adequately capture the relationship. The curve is unitless, so two tanks with the same or similar shapes could use the same curve values even if the sizes are different.
As with Pump Curves, Tank Curves are defined on a separate tab of the Configuration Excel file, with each row of the curve given the same name to group them into a single curve. Curves should always start with Depth, Volume percentages of 0, 0 and end at 100, 100.
When uploading the configuration template take attention to potential errors or warnings that will be listed under the notification bell icon. In case there are issues during the template upload, those messages usually provide more detail about the type of error.
3.14. Power BI
The existing dashboards of WaterSight can be extended with custom Power BI dashboards to achieve utility-specific insights. More information below:
4. Managing User Permissions
Once the initial configuration of the WaterSight Digital Twin is complete, you can begin adding additional authorized users from the utility to have access. See Managing Team Members for more information.
If there are specific parts of the WaterSight User Interface that you wish to hide from users, either because they are still being configured or not applicable to the utility, this can be managed in the Settings --> Topic Visibility page. Topics can be hidden either from Users, Admins, or both. The Comments field allows you to describe why a topic is being hidden, and under what circumstances it should be set visible again.
5. Other resources - WaterSight Learning Resources
Click in the link below to accede more information, including an introduction to the software, more detailed help information, Frequently Asked Question (FAQs), TechNotes, etc.
WaterSight Learning Resources Guide